Taking flight with R
Feb 17, 2018 00:00 · 477 words · 3 minute read
Inspired by the current exhibit on ART ∩ MATH at Seattle’s Center on Contemporary Cart (COCA), I decided to replicate one of the pieces by the very talanted Iranian mathematical artist, Hamid Naderi Yeganeh. Yeganeh provided the full mathematical equation as a caption to his piece, “Bird,” and I thought it would be fun to give it a test flight in R. This turned out to be straightforward thanks to R’s native vectorization:
k <- 1:9830

X <- function(k) {
  sin(pi * k / 20000) ^ 12 *
  (0.5 * cos(31 * pi * k / 10000) ^ 16 *
  sin(6 * pi * k / 10000) + (1 / 6 * sin(31 * pi * k / 10000)) ^ 20) +
  3 * k / 20000 + cos(31 * pi * k / 10000) ^ 6 *
  sin((pi / 2) * ((k - 10000) / 10000) ^ 7 - pi / 5)
}

Y <- function(k) {
  -9 / 4 * cos(31 * pi * k / 10000) ^ 6 *
  cos(pi / 2 * ((k - 10000) / 10000) ^ 7 - pi / 5) *
  (2 / 3 + (sin(pi * k / 20000) * sin(3 * pi * k / 20000)) ^ 6) +
  3 / 4 * cos(3 * pi * ((k - 10000) / 100000)) ^ 10 *
  cos(9 * pi * ((k - 10000) / 100000)) ^ 10 *
  cos(36 * pi * ((k - 10000) / 100000)) ^ 14 +
  7 / 10 * ((k - 10000) / 10000) ^ 2
}

R <- function(k) {
  sin(pi * k / 20000) ^ 10 *
  (1 / 4 * cos(31 * pi * k / 10000 + 25 * pi / 32) ^ 20 +
  1 / 20 * cos(31 * pi * k / 10000) ^ 2) +
  1 / 30 * (3 / 2 - cos(62 * pi * k / 10000) ^ 2)
}

bird <- data.frame(x = X(k), y = Y(k), r = R(k))
Now that we have a data frame of x and y coordinates, including a vector of radii for the circles centered at these coordinates, we just need to draw the circles. We need to use coord_fixed() because each of the 9,830 circles has not only x and y coordinates but a particular radius defined on the same scale. On my first attempt, I used geom_point to map the circles’ radii to the size aesthetic. However, the result was distorted because the geom is not scaled 1-to-1 on the coordinate system in which the data is plotted. Fortunately, Thomas Lin Pedersen’s ggforce package had exactly the function I needed: geom_circle.
library(ggforce)## Loading required package: ggplot2p <- ggplot() +
geom_circle(aes(x0 = x, y0 = y, r = r),
data = bird,
n = 30) +
coord_fixed() +
theme_void()
p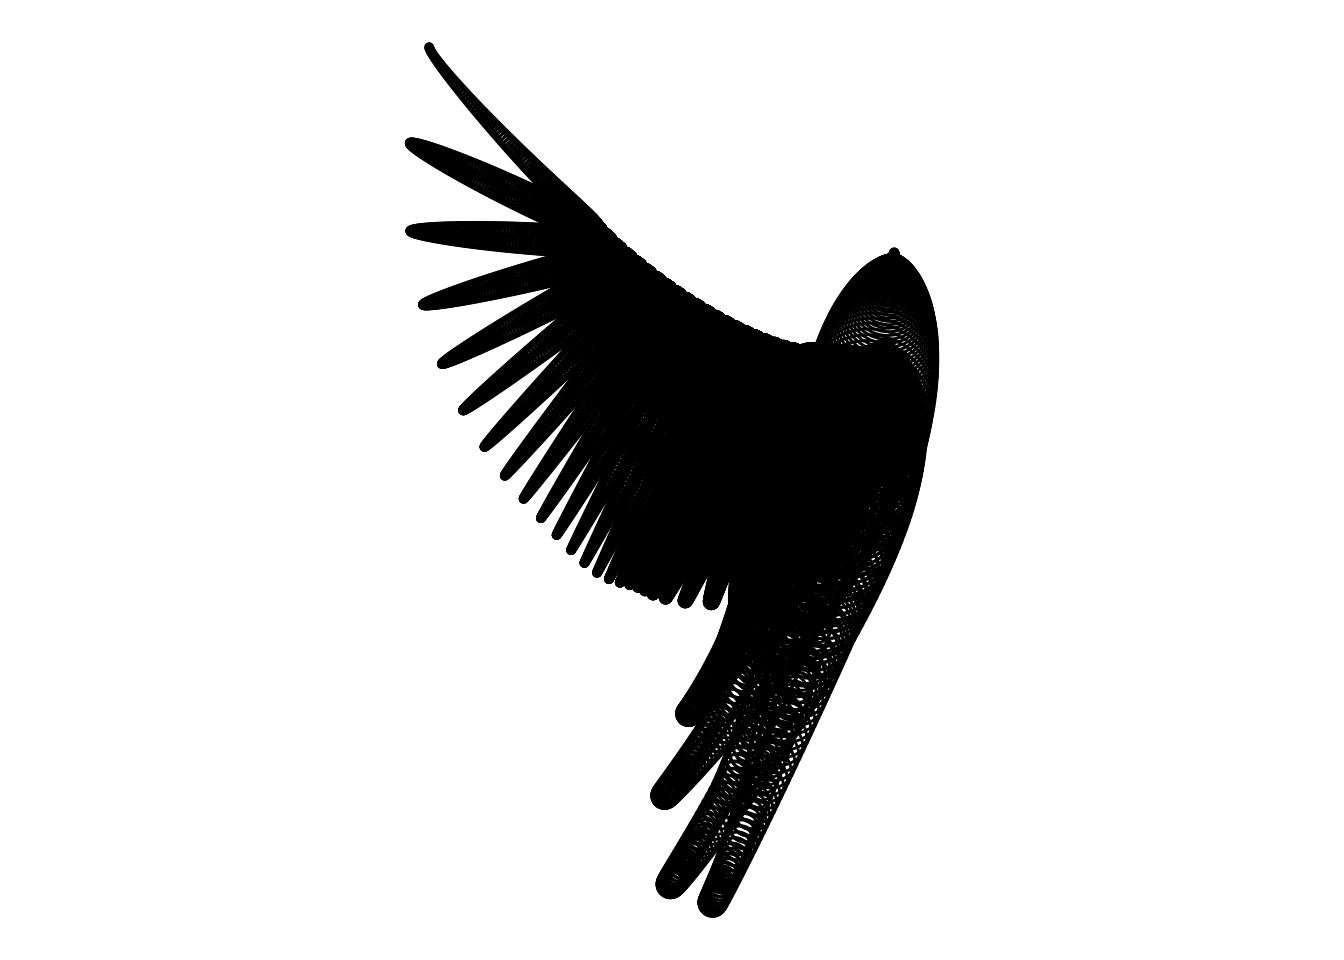
Isn’t math beautiful?